Your Revenue Gap Report
See exactly where you rank against your closest competitors in revenue, occupancy, and nightly rate, plus the dollar gap you are leaving on the table.


Discover exactly where you rank against nearby properties and what you can fix today to close the gap.
Submit
Share your name, email, and listing or address.
We analyze
We run a full audit of your listing and stack your performance against nearby competitors to uncover your revenue gap.
You receive your report
Your Revenue Gap Report arrives within 48 hours.
See exactly where you rank against your closest competitors in revenue, occupancy, and nightly rate, plus the dollar gap you are leaving on the table.
I will identify what is costing you bookings right now and give you a prioritized list of changes ranked by impact.
A custom video walkthrough of your listing where I show you what top performers are doing differently and explain exactly what to fix and why.
Case Studies
These are real gaps we found for Charleston owners before they partnered with Travel Charleston. Income they were missing without realizing it.
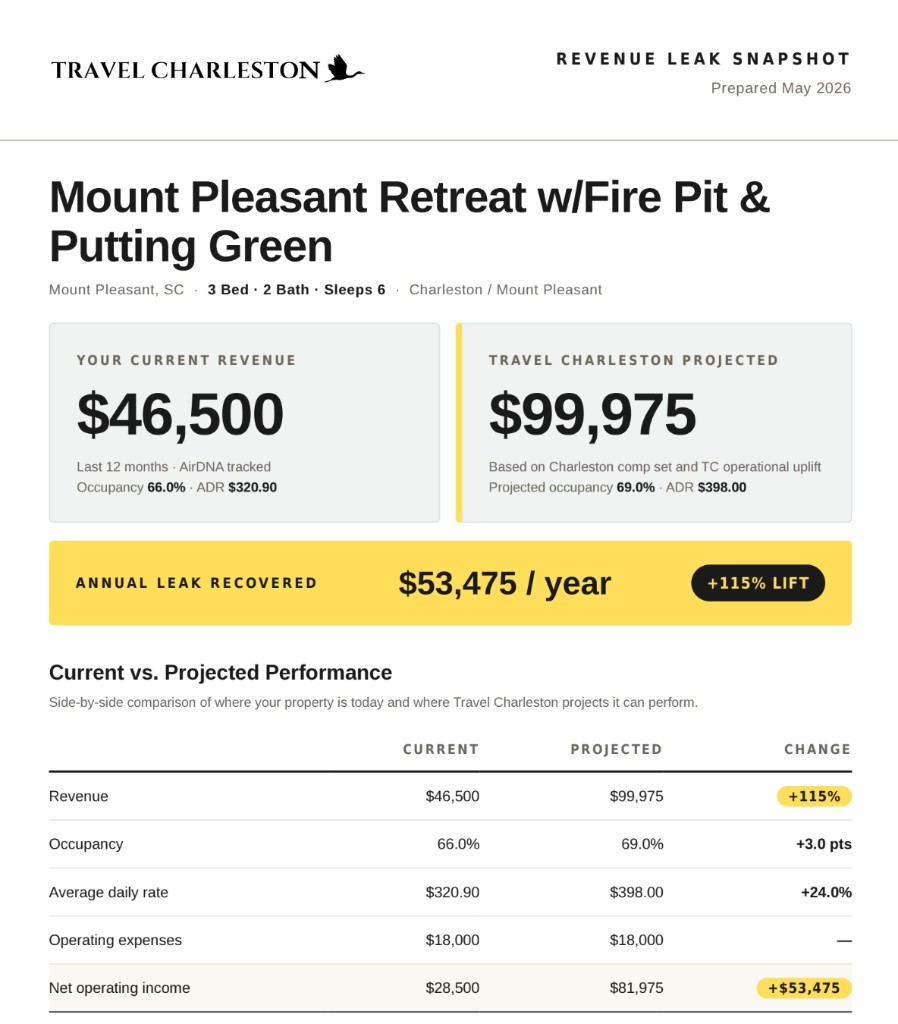
Mount Pleasant Retreat 3 bed 2 bath houseThis Mount Pleasant property was generating $46,500 annually at 66% occupancy. Against nearby competitors, we identified a 115% revenue gap. Pricing, presentation, and positioning were all leaving money on the table.
$53,475 / year uncovered
Townhouse in Park Circle 3 bed 2.5 bath townhouseA Park Circle home was priced below its comp set nightly average with photos ranking in the bottom third of nearby listings. The owner had no idea they were underperforming by over $2,600 per month.
$31,200 / year uncovered
House in West Ashley 3 bed 2 bath houseThe owner assumed their West Ashley rental was performing well. Our analysis ranked it below most nearby competitors in revenue. A gap driven by seasonal pricing and an under-optimized listing profile.
$42,800 / year uncovered